Data Engineering Project: Stream Edition
- 1. Introduction
- 2. Sample project
- 3. Streaming concepts
- 4. Future work
- 5. Conclusion
- 6. Further reading
- 7. References
1. Introduction
Stream processing differs from batch; one needs to be mindful of the system’s memory, event order, and system recovery in case of failures. If you have wondered
What are some streaming project ideas that I could start working on and gain some DE experience?
Are there any end-to-end streaming pipeline tutorials?
How to understand the foundational skills required to build streaming pipelines?
Then this post is for you. In this post, we will design & build a streaming pipeline that multiple marketing companies build in-house. We will create a real-time first click attribution pipeline .
By the end of this post, you will know the fundamental concepts to build your streaming pipelines. We will use Apache Flink and Apache Kafka for stream processing and queuing. However, the ideas in this project apply to all stream processing systems.
2. Sample project
Consider we run an e-commerce website. An everyday use case with e-commerce is to identify, for every product purchased, the click that led to this purchase. Attribution is the joining of checkout(purchase) of a product to a click. There are multiple types of attribution
; we will focus on First Click Attribution.
Our objectives are:
- Enrich checkout data with the user name. The user data is in a transactional database.
- Identify which click leads to a checkout (aka attribution). For every product checkout, we consider the earliest click a user made on that product in the previous hour to be the click that led to a checkout.
- Log the checkouts and their corresponding attributed clicks (if any) into a table.
2.1. Prerequisites
To run the code, you’ll need the following:
- git
- Docker with at least 4GB of RAM and Docker Compose v1.27.0 or later
- psql
2.2. Architecture
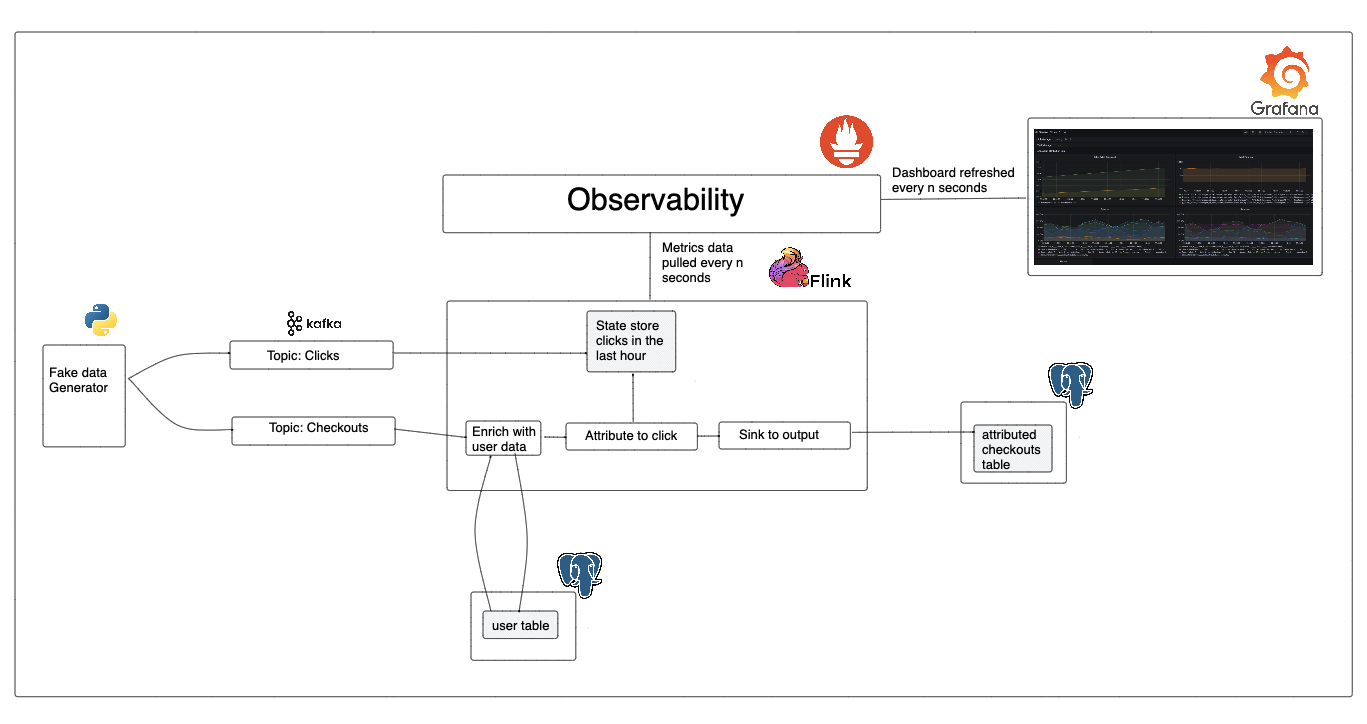
Our streaming pipeline architecture is as follows (from left to right):
Application: Website generates clicks and checkout event data.Queue: The clicks and checkout data are sent to their corresponding Kafka topics.Stream processing:- Flink reads data from the Kafka topics.
- The click data is stored in our cluster state. Note that we only store click information for the last hour, and we only store one click per user-product combination.
- The checkout data is enriched with user information by querying the user table in Postgres.
- The checkout data is left joined with the click data( in the cluster state) to see if the checkout can be attributed to a click.
- The enriched and attributed checkout data is logged into a Postgres sink table.
Monitoring & Alerting: Apache Flink metrics are pulled by Prometheus and visualized using Graphana.

2.3. Code design
We use Apache Table API to
- Define Source systems: clicks, checkouts and users . This python script generates fake click and checkout data.
- Define how to process the data (enrich and attribute): Enriching with user data and attributing checkouts
- Define Sink system: sink
The function run_checkout_attribution_job creates the sources, and sink and runs the data processing.
We store the SQL DDL and DML in the folders source, process, and sink corresponding to the above steps. We use Jinja2
to replace placeholders with config values
. The code is available here
.
2.4. Run streaming job
Clone and run the streaming job (via terminal) as shown below:
git clone https://github.com/josephmachado/beginner_de_project_stream
cd beginner_de_project_stream
make run # restart all containers, & start streaming job
- Apache Flink UI: Open http://localhost:8081/
or run
make uiand click onJobs -> Running Jobs -> checkout-attribution-jobto see our running job. - Graphana: Visualize system metrics with Graphana, use the
make opencommand or go to http://localhost:3000 via your browser (username:admin, password:flink).
Note: Checkout Makefile
to see how/what commands are run. Use make down to spin down the containers.
3. Streaming concepts
We will review core streaming concepts and see how they apply to our project. The concepts explained in this section are crucial to understanding any streaming system.
3.1. Data flow
In stream processing, each data point (a JSON/row/etc.) flows through a series of transformations. Data flow is usually composed of the following:
- Source: Every streaming system will have at least one source. The sources can be sensors, IoT devices, social media feeds, queues, or any other data-producing system.
- Transformations: After data ingestion from the source, it undergoes a series of transformations. Some examples of transformations are enriching, filtering, aggregating, or modifying the data according to the desired business logic.
- Sink: A sink is responsible for receiving the processed data and persisting it or forwarding it to other systems for further analysis or actions. Examples of sinks include databases, data lakes, message queues, external services, or even another stream processing pipeline.
Shown below is how our data flows:

3.2. State
State refers to mutable data stored in our cluster as part of our data processing. When data processing involves a transformation that requires the system to combine multiple rows (aka wide transformations) (e.g., GROUP BY checkout_hour, JOINS, etc.), we need a way to store the rows.
There are multiple types of state backends that we can set up:
- Hash map (default): Store data in memory as part of Java heap(Apache Flink runs on JVM). The hash map state is extremely fast (in-memory), but the state size is bounded by the amount of memory available in the cluster.
- Rocks DB: Data is stored in a dedicated RocksDB database. Rocks DB allows us to use disk space for storage and store much larger states than a hash map. However, this also increases latency due to reading from the disk.
In our project, we use a hash map state and only store the clicks from the last hour; Flink discards the older clicks from the state.
3.3. Time attributes & watermarking
Understanding time attributes in stream processing is critical since the data may arrive out of order, and we need to ensure that the computations are performed as expected.
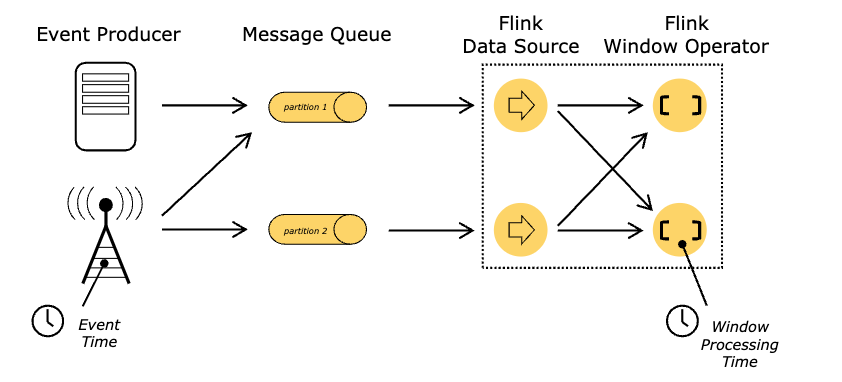
For any event, there are two types of time:
- Event time: The time when the event occurred (produced by the system generating data).
- Processing time: The time when the event is processed by a system (e.g., Apache Flink), defined as
processing_time AS PROCTIME()in our sink definitions.

Since events may arrive late, we need a mechanism to let Apache Flink know how long to wait for an event. E.g., If we are grouping data by hour, how long after the hour (h1) has ended, should the system allow a h1 event that arrives late to affect the output? This is where watermarking comes in.
Watermarking is a mechanism that tells the stream processing system to wait for n-time units to allow late-arriving events. E.g., if the watermark is 5 mins, Apache Flink will wait 5 minutes for any late arriving events corresponding to the current time to impact the output. Apache Flink will ignore events (corresponding to the present time) after the watermark interval (5 min).
In our project, We get event time from the source data. We define a watermark of 15 seconds on event time. Our clicks and checkouts table will wait 15 seconds before being considered fully complete, i.e., if an event arrives 12 seconds late, it will be part of, say, a “group by”; however, if it comes later than 15 seconds, it will not be considered part of the computation.
datetime_occured TIMESTAMP(3),
WATERMARK FOR datetime_occured AS datetime_occured - INTERVAL '15' SECOND
3.4. Backpressure
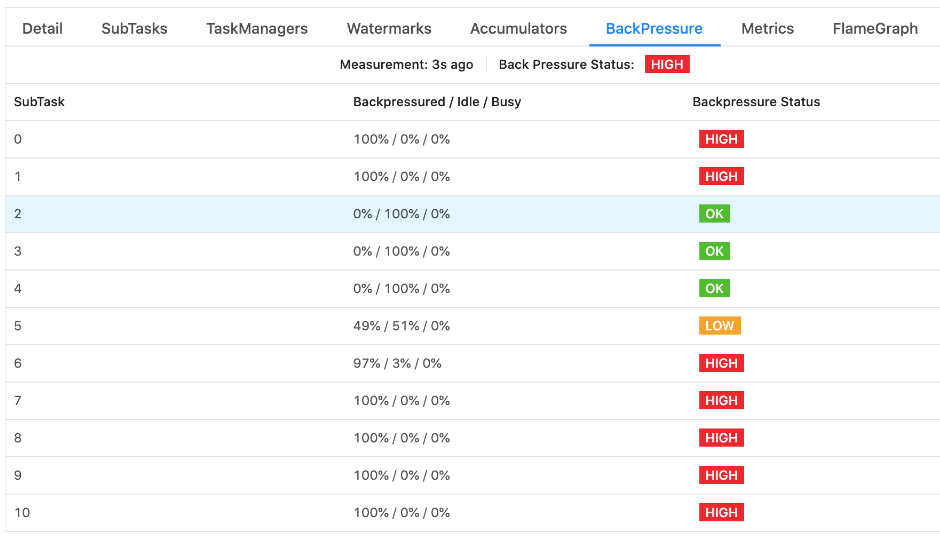
When an upstream process/system produces data at a rate faster than a process can keep up. Backpressure causes data to be accumulated in memory (unless the upstream system is an external one like Kafka), which, if left unchecked, can cause out-of-memory errors. We can monitor this via the Flink UI.

3.5. Dynamic outputs
Since streaming systems operate on constantly flowing data, the output of a specific function/query may be updated in response to incoming data. We need to know if our outputs are append-only or allow upserts since certain sink systems are append-only (e.g. Kinesis is append only ).
We can determine if the output is append-only or allows upserts by looking at the execution plan. In Python, we can do this as shown below.
t_env.execute_sql("""
EXPLAIN CHANGELOG_MODE
<your-select-query>""").print()
In the output, check the topmost node of the Optimized Physical Plan; this will have the changelogMode. Each letter in the changelogMode array corresponds to a specific type of change event:
I: Insert events indicate a row insert.UA: Update-After events represent an update to an existing row, providing the latest version of the row after the update.D: Delete events indicate a row delete.
See this page for more details.
3.6. Joins
This section will cover the techniques used to join streaming data with other streams and static datasets.
3.6.1. Regular joins
These are standard joins between multiple data streams without constraining on time (event or processing). If an input row is updated/deleted, this will impact all the previous output data that involved this row. Regular joins require Flink to keep the datasets in the state indefinitely!
One can use time to live setting to drop rows that have not updated for n time-units. However, this may cause data correctness issues.
3.6.2. Time-based joins
As with most operations on streaming systems, time bounding is a common technique to limit state and ensure output is available quickly.
3.6.2.1. Interval joins
In an interval join, we join data streams based on the key(s) and a condition ensuring that one stream’s time falls (e.g., say a) within a range of time of the other stream (e.g., say b).
Only Append-only tables with a time column are supported. Since the tables are append-only and the time column’s values are increasing, Flink can stream a’s data while keeping a limited amount of b’s data (bounded by a’s time) in the state.
In our example, we use interval join when joining checkout with clicks in the past hour.
checkouts AS co
  JOIN users FOR SYSTEM_TIME AS OF co.processing_time AS u ON co.user_id = u.id
  AND co.product_id = cl.product_id
  AND co.datetime_occured BETWEEN cl.datetime_occured
  AND cl.datetime_occured + INTERVAL '1' HOUR
We see that we match checkouts with clicks between the click time and 1 hour after the click time. The time interval joins criteria shown above ensures that we only need to keep clicks that happened in the last hour (of the checkout time) in the state.
3.6.2.2. Temporal joins
We use this when we want to join a data stream with another one at a specific time.
FROM orders
LEFT JOIN currency_rates FOR SYSTEM_TIME AS OF orders.order_time
ON orders.currency = currency_rates.currency;
This above query will join the orders data stream with the currency_rates data stream as of order_time. If an order row comes in 10 hours late, the above query will join that row with currency_rates from 10 hours ago.
Note The currency_rate table here is a versioned table . A versioned table will be automatically created by Flink when the source of the table is updating (e.g., Debezium source).
3.6.2.3. Lookup joins
This join adds external data (aka enrich) to a data stream. We use this in our project to enrich checkout data with user information. The user table resides in a Postgres db, which we connect to with a JDBC connector. Apache Flink will recognize the user table as an external table because its config
uses JDBC to connect to Postgres.
FROM
checkouts AS co
JOIN users FOR SYSTEM_TIME AS OF co.processing_time AS u ON co.user_id = u.id
Note that the SYSTEM_TIME tells the system to join checkout data with user data when the checkout data is processed (processing_time). Joining based on a specific time ensures that future user table updates will not cause an update on already enriched checkout data.
3.6.2.4. Window joins
Window joins allow us to join data streams based on time frames (in addition to joining key(s)). There are two main characteristics of these windows of time:
- Size: This represents the size of the window.
- Slide: This represents how the window will move along. Sliding can be overlapping or non-overlapping, depending on the window type. Sliding window is the only overlapping window.
The different types of windows are explained here
3.7. Monitoring
It is critical to have a monitoring system to alert ops in case of high usage and possible latency issues. Monitoring enables devs to ensure that the system continues to operate without problems or can recover quickly in case of any issues.
3.7.1. Metrics
Apache Flink exposes a number of metrics and allows us to define our own . We use Prometheus to pull metrics from Apache Flink . Prometheus collects and stores metrics in its time-series DB, enabling querying the data. Prometheus can also be configured to send out alerts. Go to http://localhost:9090 to see Prometheus UI.
Apache Flink also supports other metrics reporting systems, as mentioned here .
3.7.2. Visualization
We can use any system to visualize the metrics as long as they can query Prometheus. We use Graphana to pull data from Prometheus and update the dashboard every 3 seconds.
There are multiple metrics available; we only visualize a few metrics. Use make viz or go to http://localhost:3000
with username ‘admin’ and password ‘flink’. In Graphana UI, go to Dashboards -> Browse -> Flink to see our Flink Dashboard.
4. Future work
Multiple improvements can be made to this pipeline. Noted below are a few:
- Testing: Add tests.
- Handle cluster restarts without reprocessing data from the start of the Kafka topics.
- Alerting: Set up email alerts with Prometheus.
- Add additional metrics and send alerts on backpressure warnings, latency in the system (say if latency > 1s), and if state memory > 80% of capacity.
- Schema evolution: What happens if clicks or checkout schema changes? How will the system handle it?
Please feel free to open a PR!
5. Conclusion
While building streaming pipelines is more involved than batch pipelines, having a good understanding of the above fundamentals will enable you to build resilient and efficient streaming pipelines.
To recap, we covered the following concepts.
While streaming pipelines enable real-time data availability, it requires strong engineering & DevOps team. However, for the correct use case, the benefits are enormous. E.g., real-time trading/ML.
If you are working on a streaming project, consider the above concepts when designing the system. If you have any questions or comments, please leave them in the comment section below or open a GitHub issue.
Note: If you are interested in learning to write efficient SQL for data processing, checkout my e-book: Efficient Data Processing in SQL
6. Further reading
- Data flow patterns
- SQL for DEs
- Window functions
- Scale data pipelines
- What is CDC (Change data capture) pattern
7. References
If you found this article helpful, share it with a friend or colleague using one of the socials below!