How to reduce your Snowflake cost
- 1. Introduction
- 2. Snowflake pricing and settings inheritance model
- 3. Strategies to reduce Snowflake cost
- 4. Conclusion
- 5. Read more about using Snowflake
- 6. References
1. Introduction
Most data engineers love Snowflake, it is easy to get started, there are no “hard-to-debug” JVM errors with a long stack trace and the management is a breeze. But, what you get in convenience you may end up paying in costs. If you are
Working on data pipelines in Snowflake, written without any mind towards SQL optimization that costs a lot of money
Blindsided by management falling for aggressive up selling from warehouse vendors
At a place where you had to lay off technically good people because of sky rocketing Snowflake cost
Bombarded with “But people costs are low with Snowflake” without any clear data and asked to accept Snowflake cost
Working for a company that expects new features and reduce Snowflake costs! But you don’t have time to do both.
Then, this post is for you. In this post we will go over fours strategies that you can follow to lower your Snowflake bill. We will start with some quick wins, analyzing table structure and making changes, consolidating data pipelines, and finally setting up monitoring and alerting to ensure continued cost reduction.
By the end of this post you will have the knowledge to get some quick wins and also develop a long term plan that can drastically reduce your Snowflake bill.
2. Snowflake pricing and settings inheritance model
Before we get started, here is a TL;DR version of Snowflake’s cost model(as of May 2024, customers paying > 25k USD). Snowflake charges its users for
- Compute: This includes warehouse, Snowpipe, Automatic clustering, tasks, etc.
- Storage: This includes the data stored, moving data in and out of snowflake storage.
- Cloud services: This includes query compilation, authentication, user/role management, etc
With snowflake you buy credits (the dollar amount of the credit depends on your contract) and each of the services requires a varying amount of credit.
When signing a contract, you will typically get a set number of credits for a period(say 1-3 years) and the credit will be split over the contract period. With multiple varying credit usage, computing the actual bill can be tricky. Typically the most expensive part would be compute.
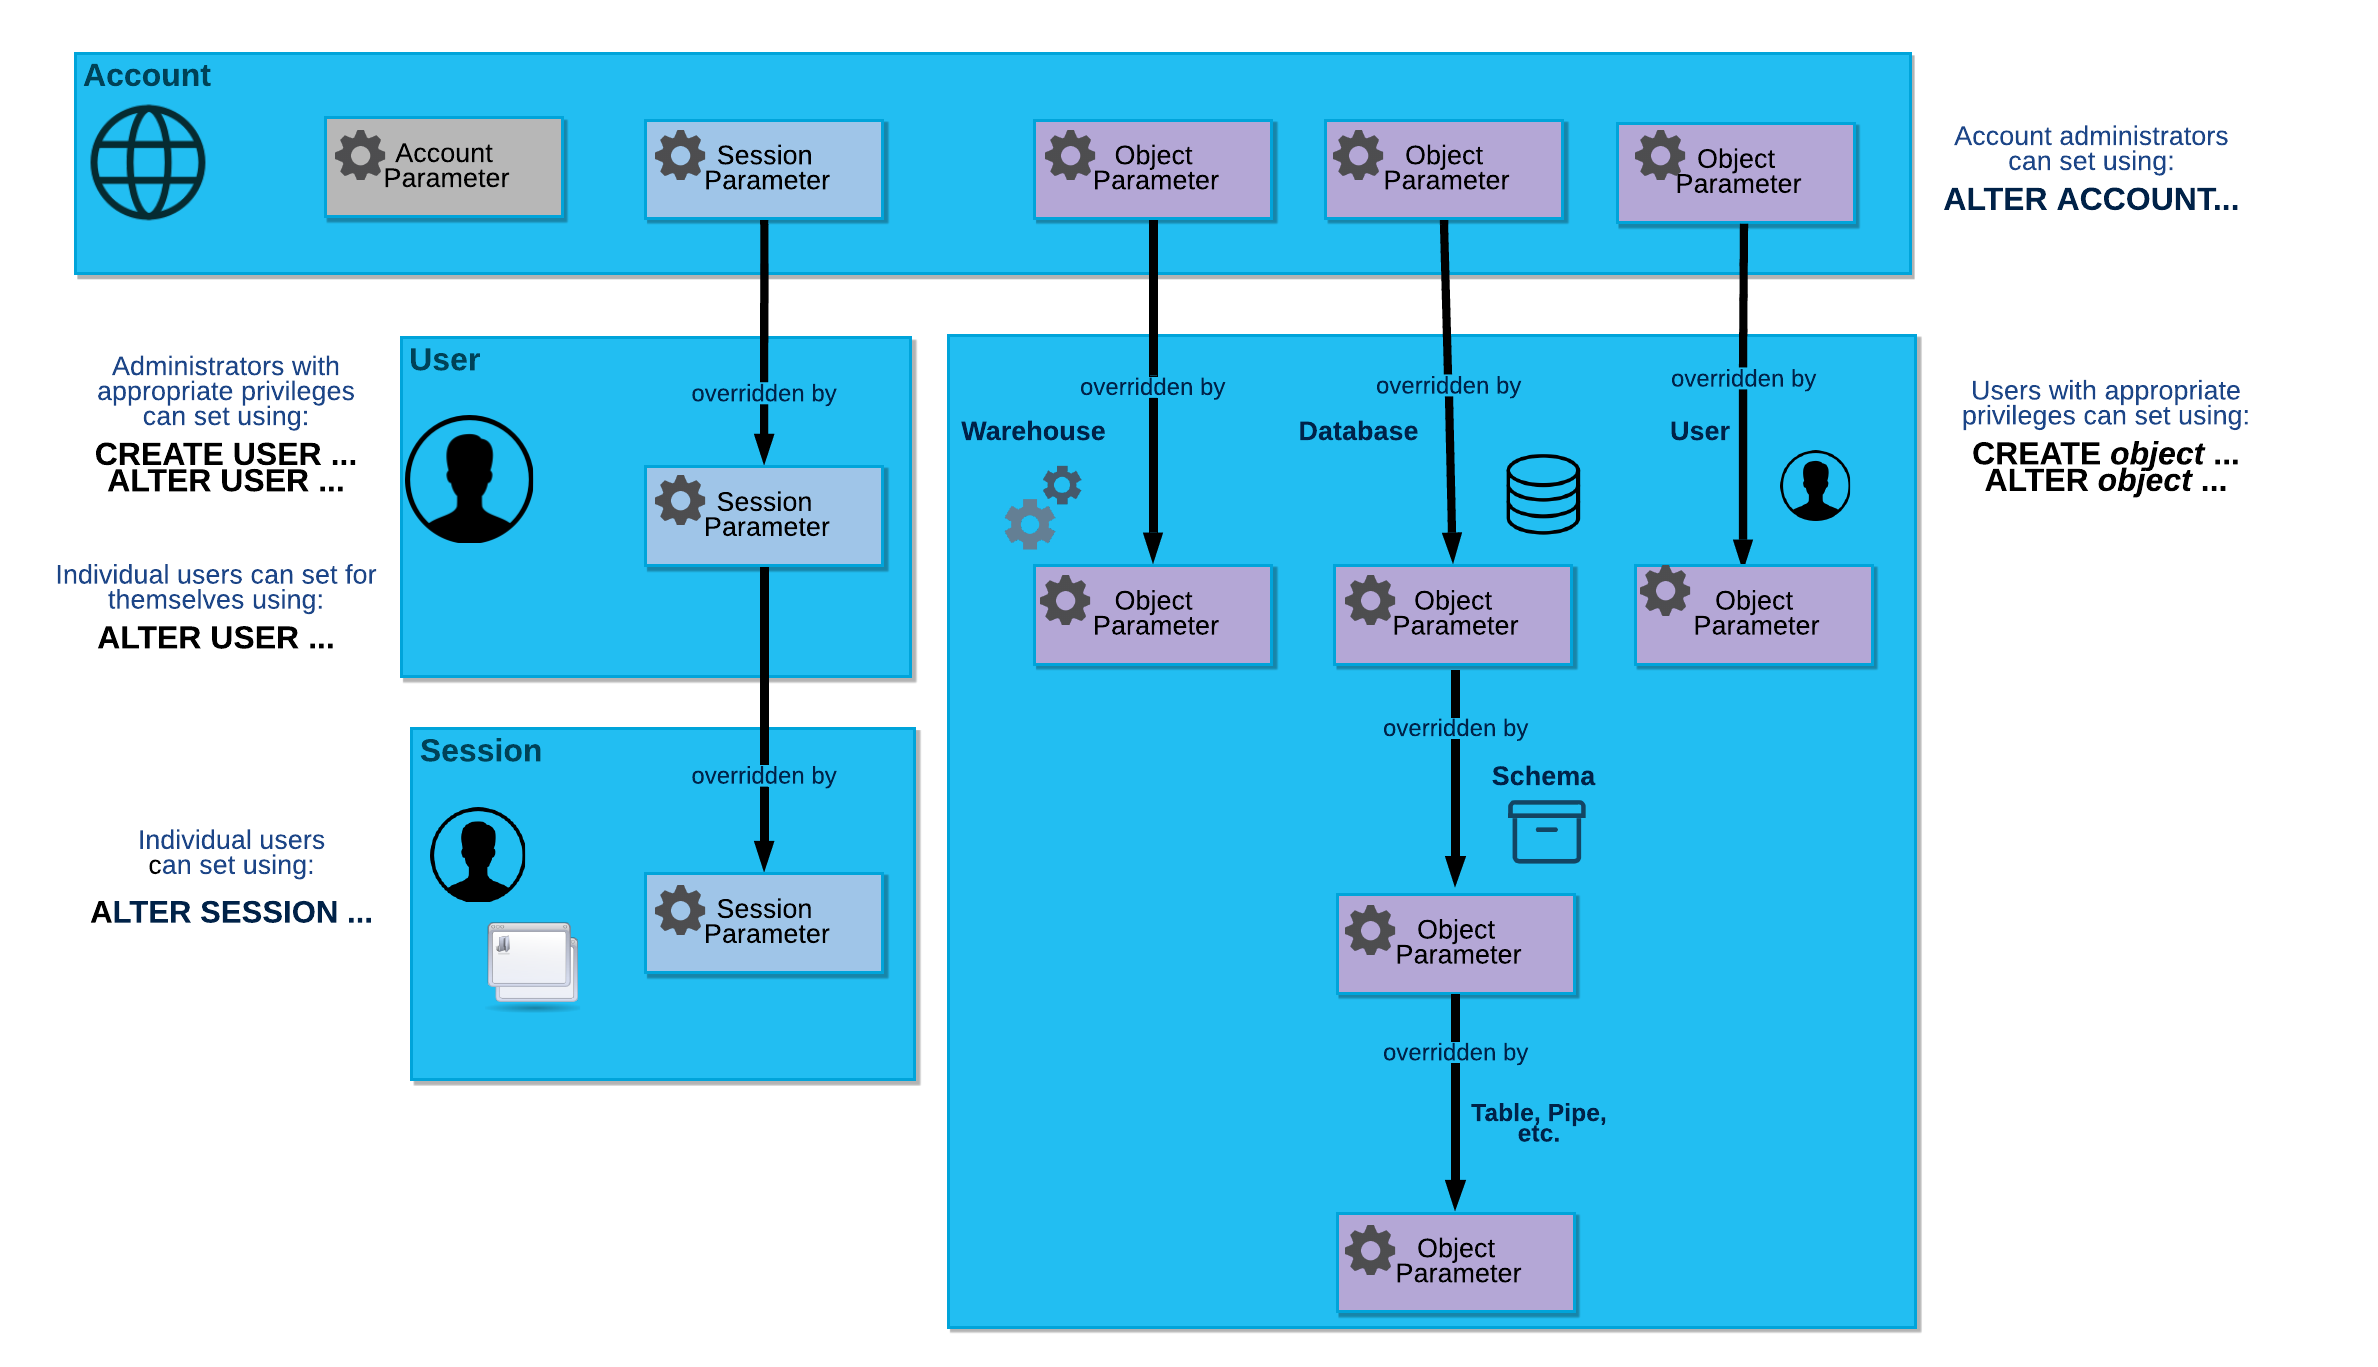
While most of the settings we see will be applied per warehouse, we can set these at different levels of Snowflake. The settings set at a lower level will override the setting at a higher level, for example a setting set per warehouse will overwrite a setting set per account.
3. Strategies to reduce Snowflake cost
We will go over four strategies to help you get some quick cost wins and set you up for long term cost control with Snowflake.
3.1. Quick wins by changing settings
In this section we will cover the warehouse settings that can save you a lot of money and go over a query that shows unused tables that can be deleted to save money.
3.1.1. Update warehouse settings
Snowflake automatically sets default values with the aim for reducing query latency and ensuring all the queries are served appropriately. However the performance benefits comes at a cost. Most data warehousing use cases do not need very high performance (think under a few seconds). We can quickly save a lot of money using the following settings:
-
AUTO_SUSPEND : Snowflake charges you for every minute that a warehouse is active. You can use the auto suspend setting to ensure that your warehouses are turned off when not used. By default the warehouses are set to be on for a longer period. Set auto suspend to 1 minute.
This means that if there have been no queries in the past 1 minute, Snowflake warehouse will turn off. The trade off is that the cached results in the warehouse will be lost, which may not be an issue if a few additional seconds of latency is tolerated.
ALTER WAREHOUSE your-warehouse-name SET AUTO_SUSPEND=60; -
STATEMENT_TIMEOUT_IN_SECONDS represents how long a query can run before timing out. By default this is set to 2 days. Most systems do not need to keep a query running for that long, choose a reasonable value for this.
A good default is to set it to about 5min, if your queries are taking longer than that you should look into optimizing it.
ALTER WAREHOUSE your-warehouse-name SET STATEMENT_TIMEOUT_IN_SECONDS = 300; -
STATEMENT_QUEUED_TIMEOUT_IN_SECONDS : Snowflake can run multiple queries at a time, the number of concurrent queries that can be run depends on the warehouse size and the complexity of the query. Snowflake will queue incoming queries if it can’t be executed immediately. By default a query will be queued forever.
Queuing a query forever means that it is possible for multiple queues to wait and not let the warehouse switch off. We can define this metric as shown below:
ALTER WAREHOUSE your-warehouse-name SET STATEMENT_QUEUED_TIMEOUT_IN_SECONDS = 300; -
Reduce warehouse size to the absolute minimum possible. Set your warehouse size to X-SMALL and if that does not perform as required for your use case then upgrade and repeat until you find a size that works well for your use case.
ALTER WAREHOUSE your-warehouse-name SET WAREHOUSE_SIZE = 'LARGE'; -
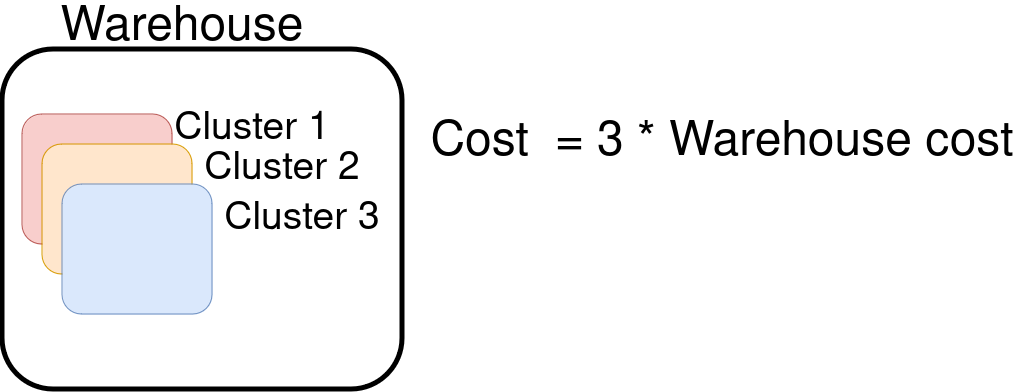
Snowflake enterprise version(and above) allows you to scale out warehouses with clusters, what this means is that if there are a lot of queries coming in Snowflake can start another cluster which is part of the same warehouse to run your queries. If you have n clusters in your warehouse, you will be charged (n * cost per warehouse). Keep the default number of clusters in warehouses to one, unless absolutely necessary.
ALTER WAREHOUSE your-warehouse-name SET MIN_CLUSTER_COUNT = 1, MAX_CLUSTER_COUNT = 1;
3.2. Analyze usage and optimize table data storage
3.2.1. Identify expensive queries and optimize them
3.2.1.1. Identify expensive queries with query_history
Use the query_history view to identify the most expensive queries. We define most expensive as the query that scans the most amount of data.
SELECT *
FROM snowflake.account_usage.query_history
WHERE START_TIME >= CURRENT_DATE - 7
ORDER BY bytes_scanned DESC
LIMIT 10;
Note a better way to compute query cost is shown here .
3.2.1.2. Optimize expensive queries
For the most expensive queries you can follow the steps here to optimize them .
Snowflake uses micro partitioning to store data internally. When you insert/update data into Snowflake, it does the following:
- Splits the data to be inserted/updated into one or more micro partitions (each about 50-500 MB before compression).
- Calculate statistical information of the micro partitions and store them in cloud services layer.
The process of creating micro partitions and how they are used when someone queries the data is shown below. Note: Right click => Open Image in New Tab, for a nicer view
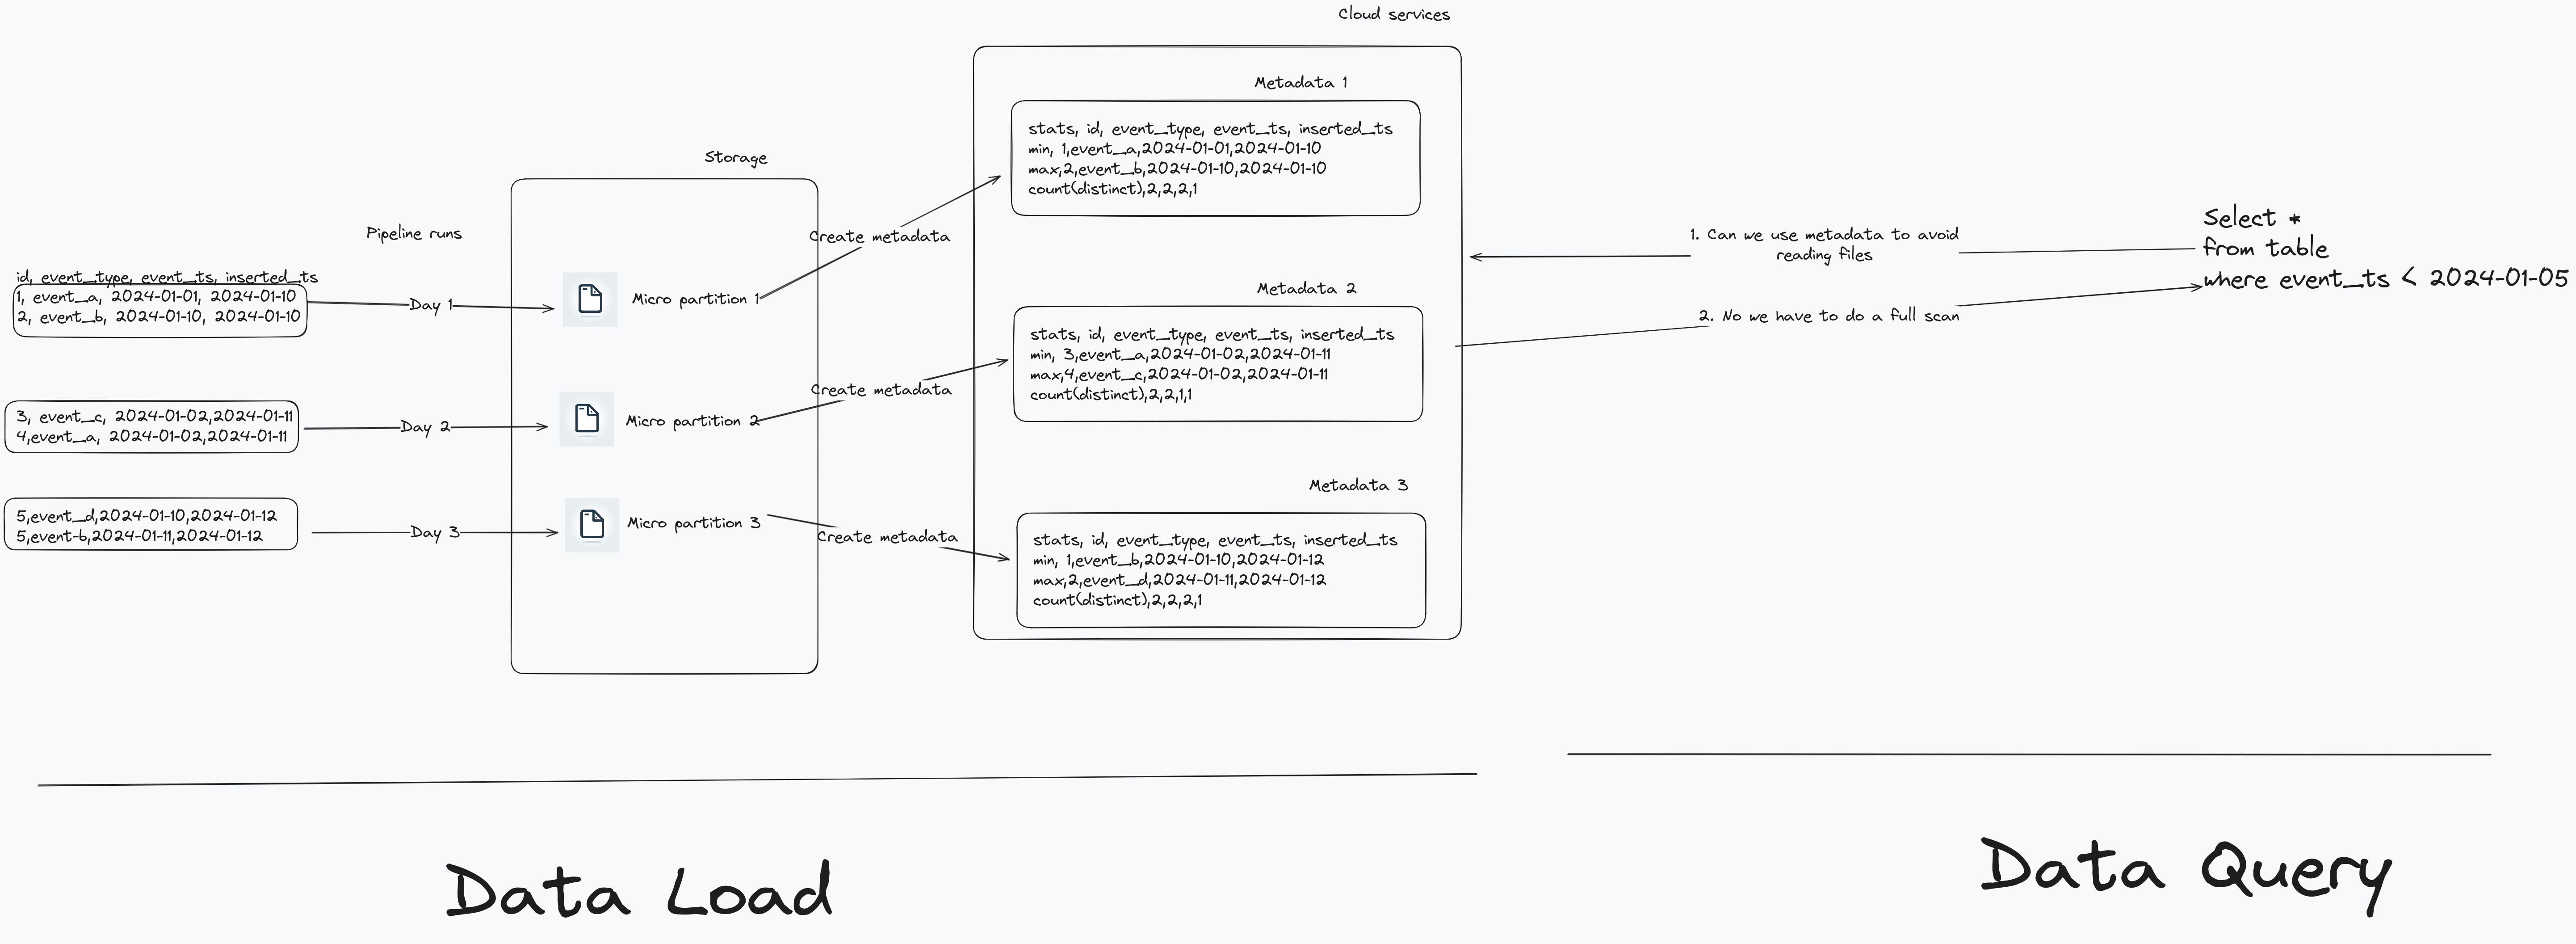
From the above image we see that when the table is partitioned by data inserted for each pipeline run. However the event_ts by which a user queries our data is not order in line with our pipeline runs. When a user queries the data with a filter on event_ts, it will not be able to use the statistical information effectively to skip reading micro partition files.
We have to ensure that our queries are able to effectively avoid reading micro partitions that are unnecessary and we can do this by using Snowflake’s automatic clustering . But automatic clustering costs a lot more than just using warehouse to process data.
If your use case permits, an alternative to automatic reclustering is to manually sort the data by the required column (event_ts in our case) before inserting it into a table. While a full table sort will not always be possible an alternative could be to sort the last n days worth of data and UPSERT-ING into the table.
3.2.2. Save on unnecessary costs by managing access control
Ensure that you have an appropriate WAREHOUSE/ROLE/USER setup, see here for an example . Make sure you have roles per department/team and assign users to their specific role. Grant the least amount of privilege for any user.
3.3. Consolidate data pipelines
While changing settings and modifying table structure and managing access can give you some quick wins. Most of the times you will need to actually change how you process data, especially if you are processing a large amounts of data with multiple data pipelines.
3.3.1. Batch data pipelines for efficient warehouse use
When developing data pipelines, most teams run pipelines as frequently as possible. While this is great for data UX, it incurs a lot of cost. Assume you have three teams, each building a data pipeline running at different times during the day, as shown below.
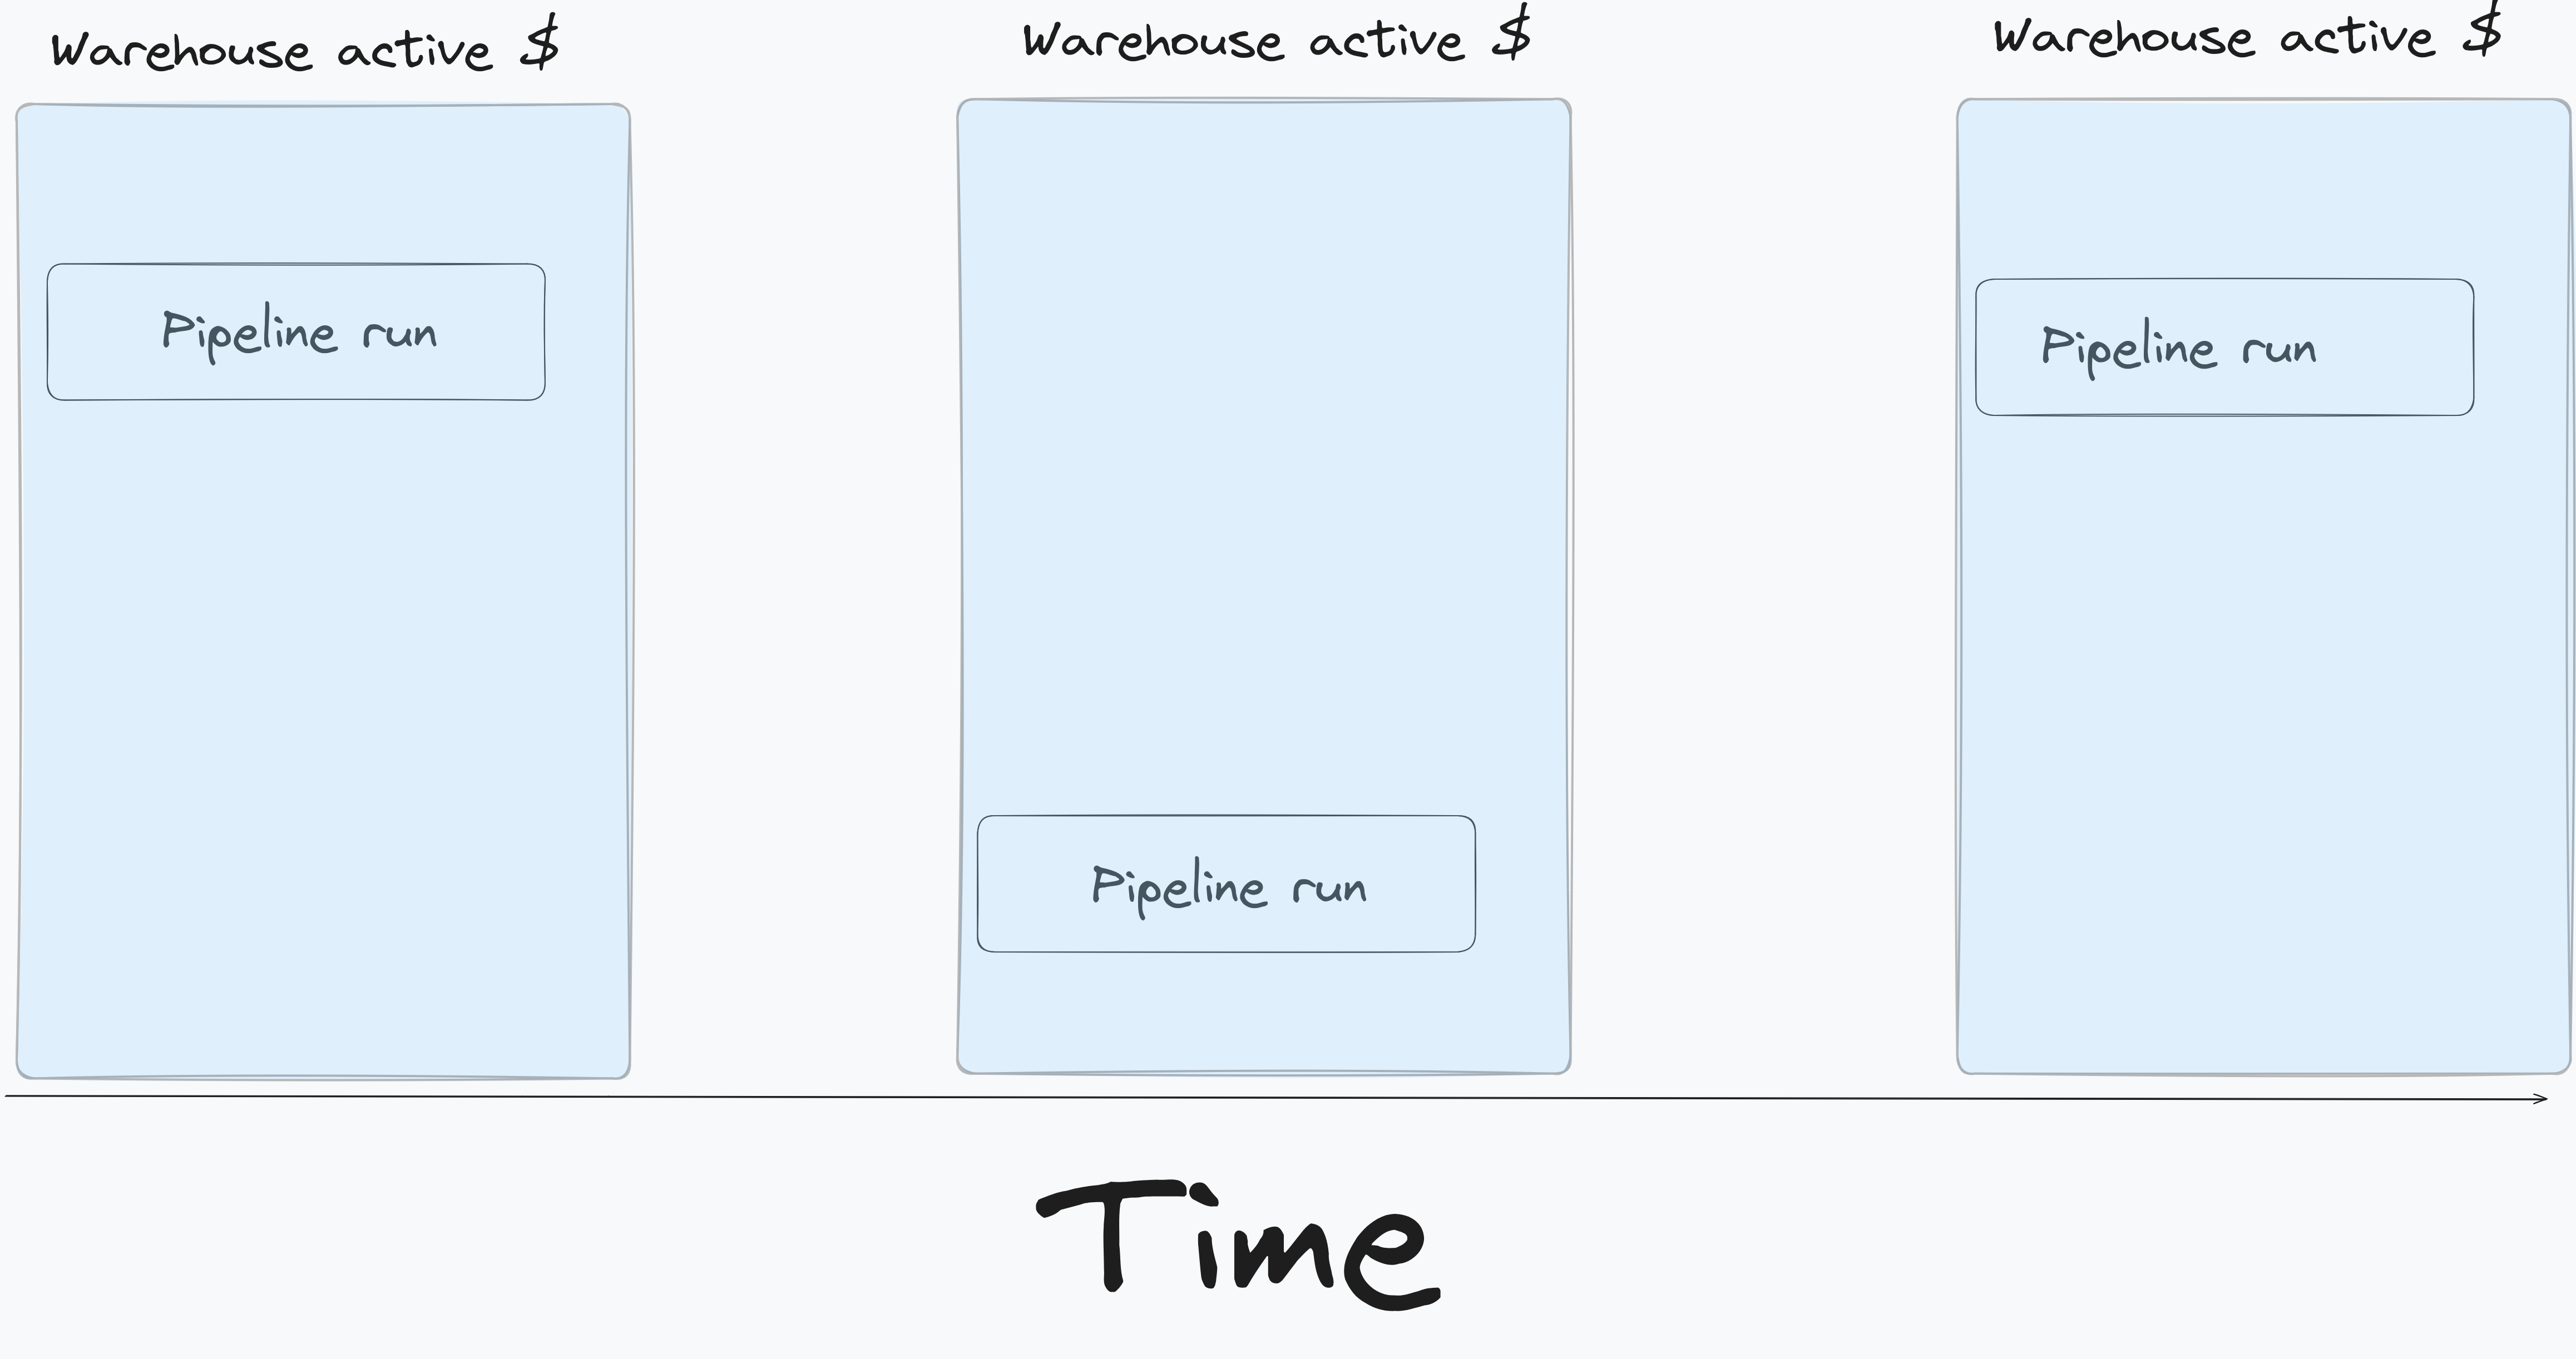
Snowflake charges based on the amount of time your warehouse is active. From the above pattern we can see that we will pay for 3 warehouse activity periods, say $$$. However if we can batch our data pipelines to run at/around the same time (as shown below) we can see that we will pay for only one warehouse activity period, so $.
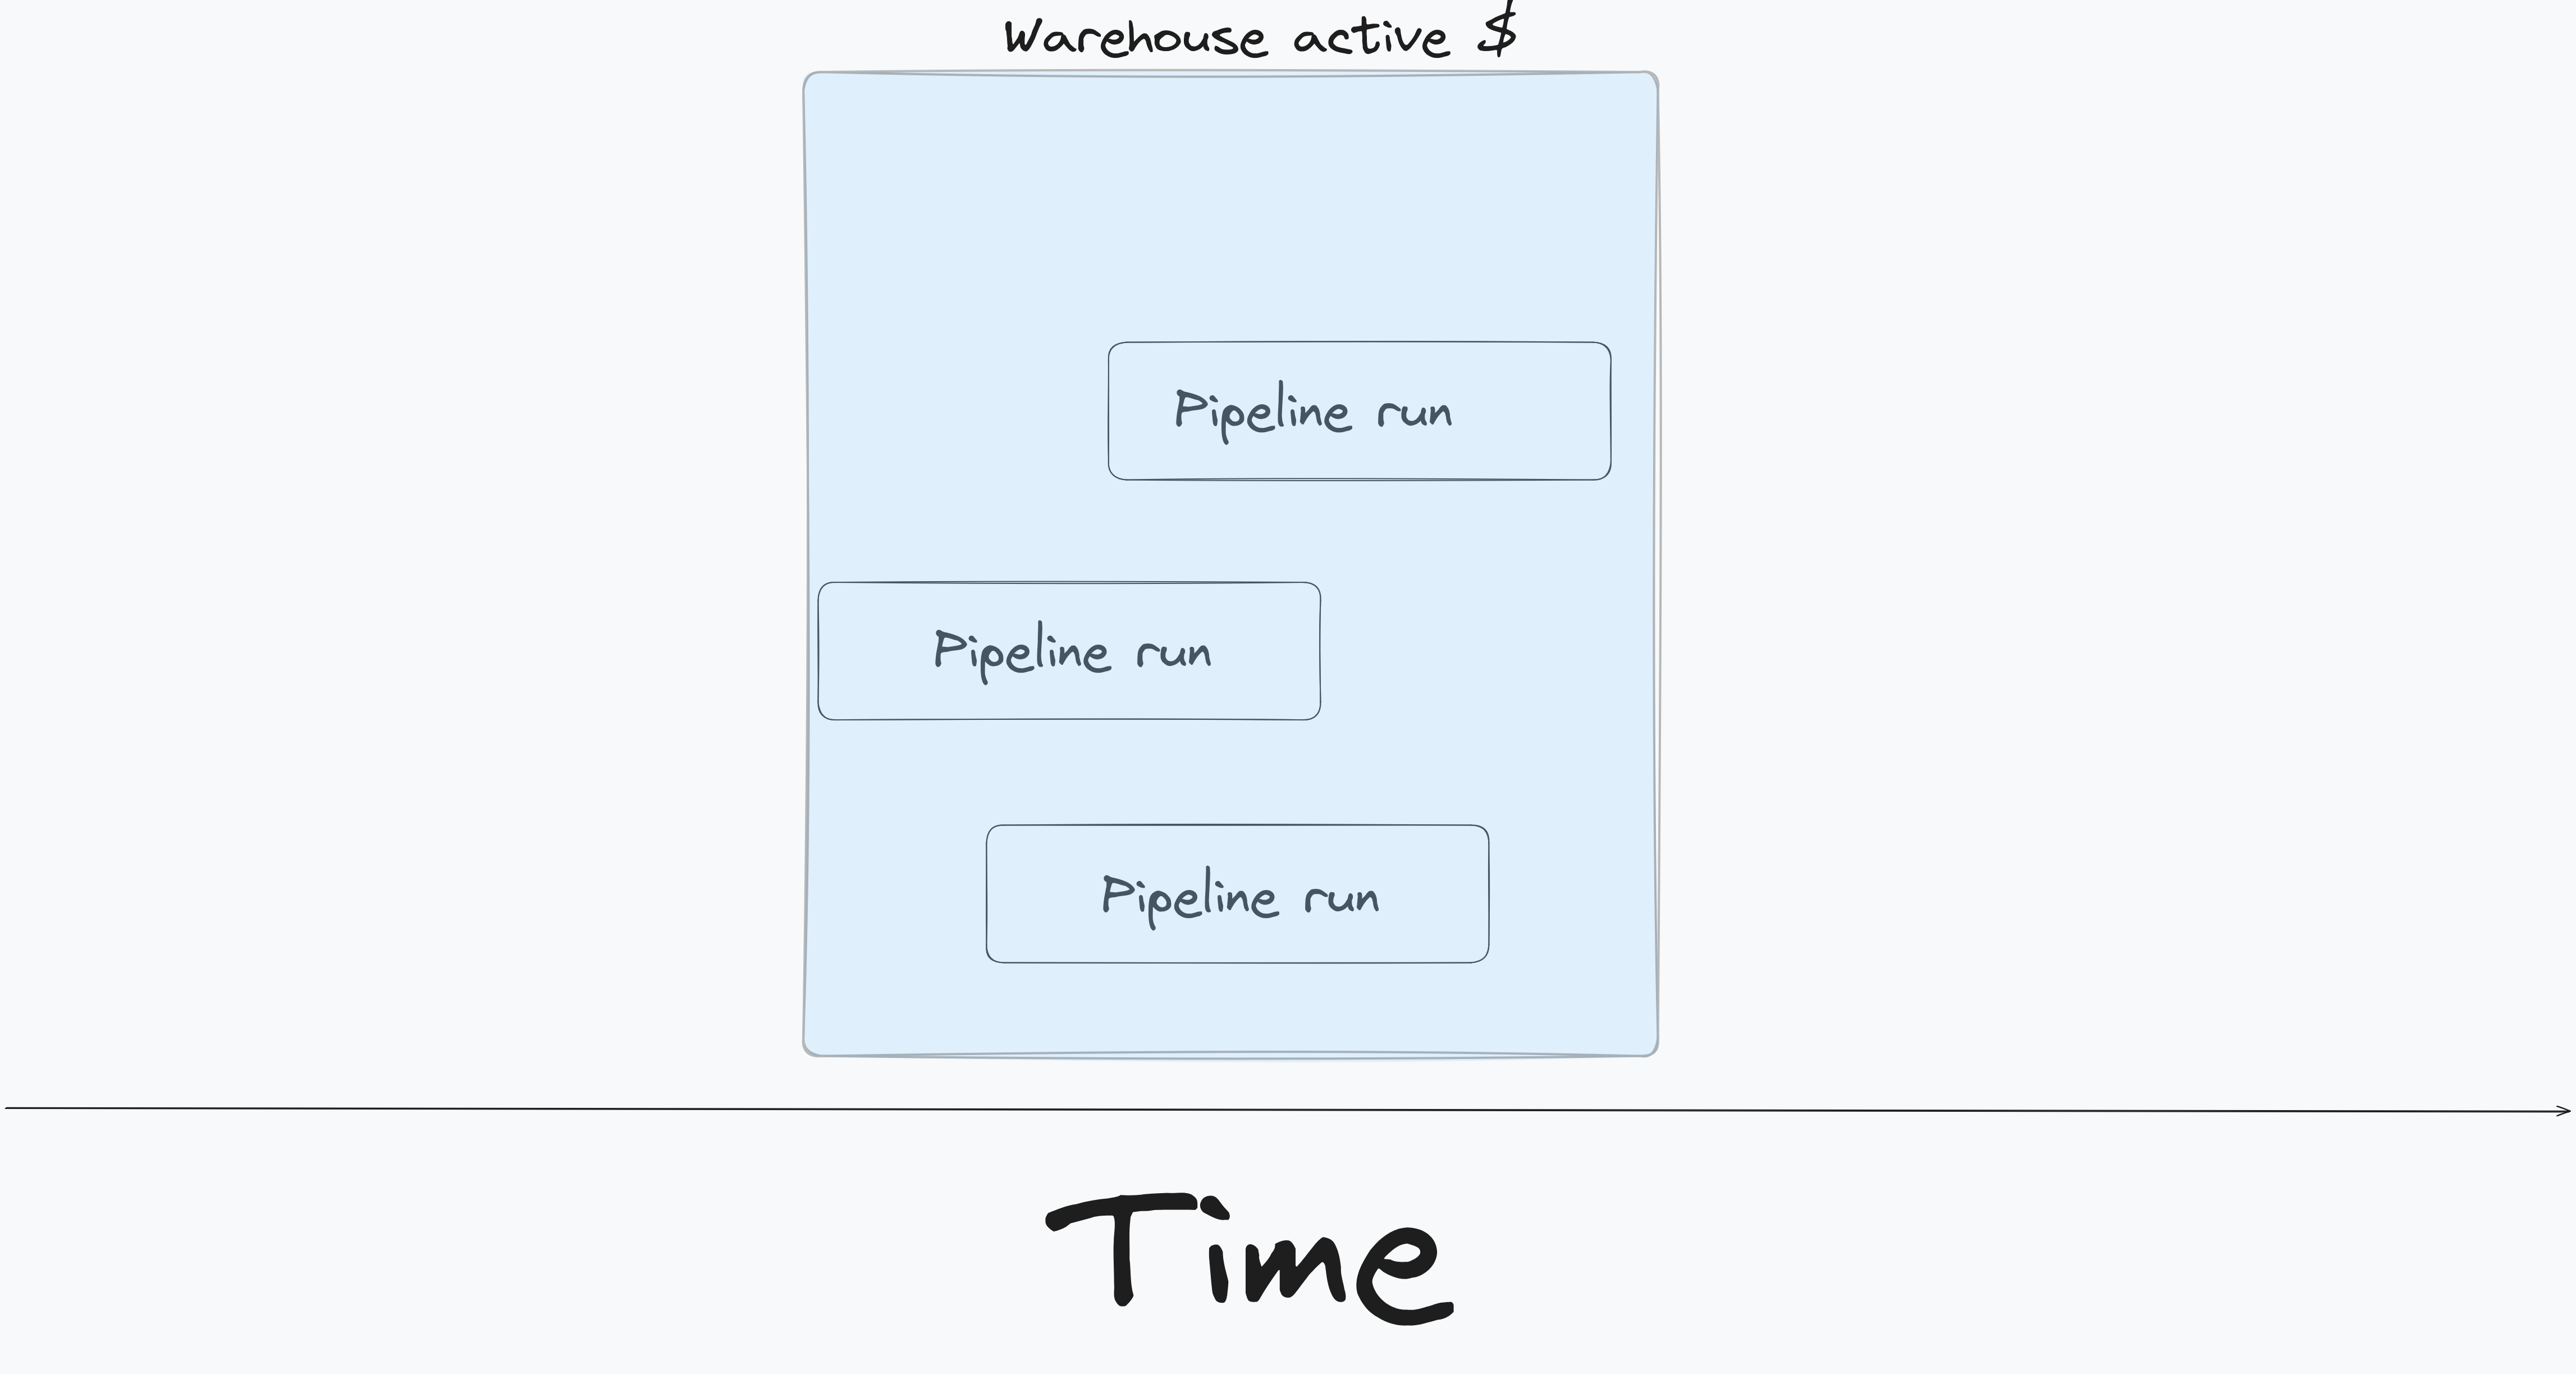
The batched pipeline approach, while saves money has the following trade offs:
- Cross team coordination to align pipeline frequency.
- Depending on the complexity of the pipeline the warehouse may need to be larger, which may end up costing money.
- Some pipelines may need to be run more frequently due to business constraints.
3.3.2. Inspect data-quality and observability tools they may result in multiple table scans
Most data quality and observability tools lets you define what to test for, but the framework decided how the tests are run. While these tools are very helpful, they are not often written with cost and performance in mind. Some of the data quality tools may result in multiple table scans!
For example: With dbt tests, each test corresponds to a table read as shown below.
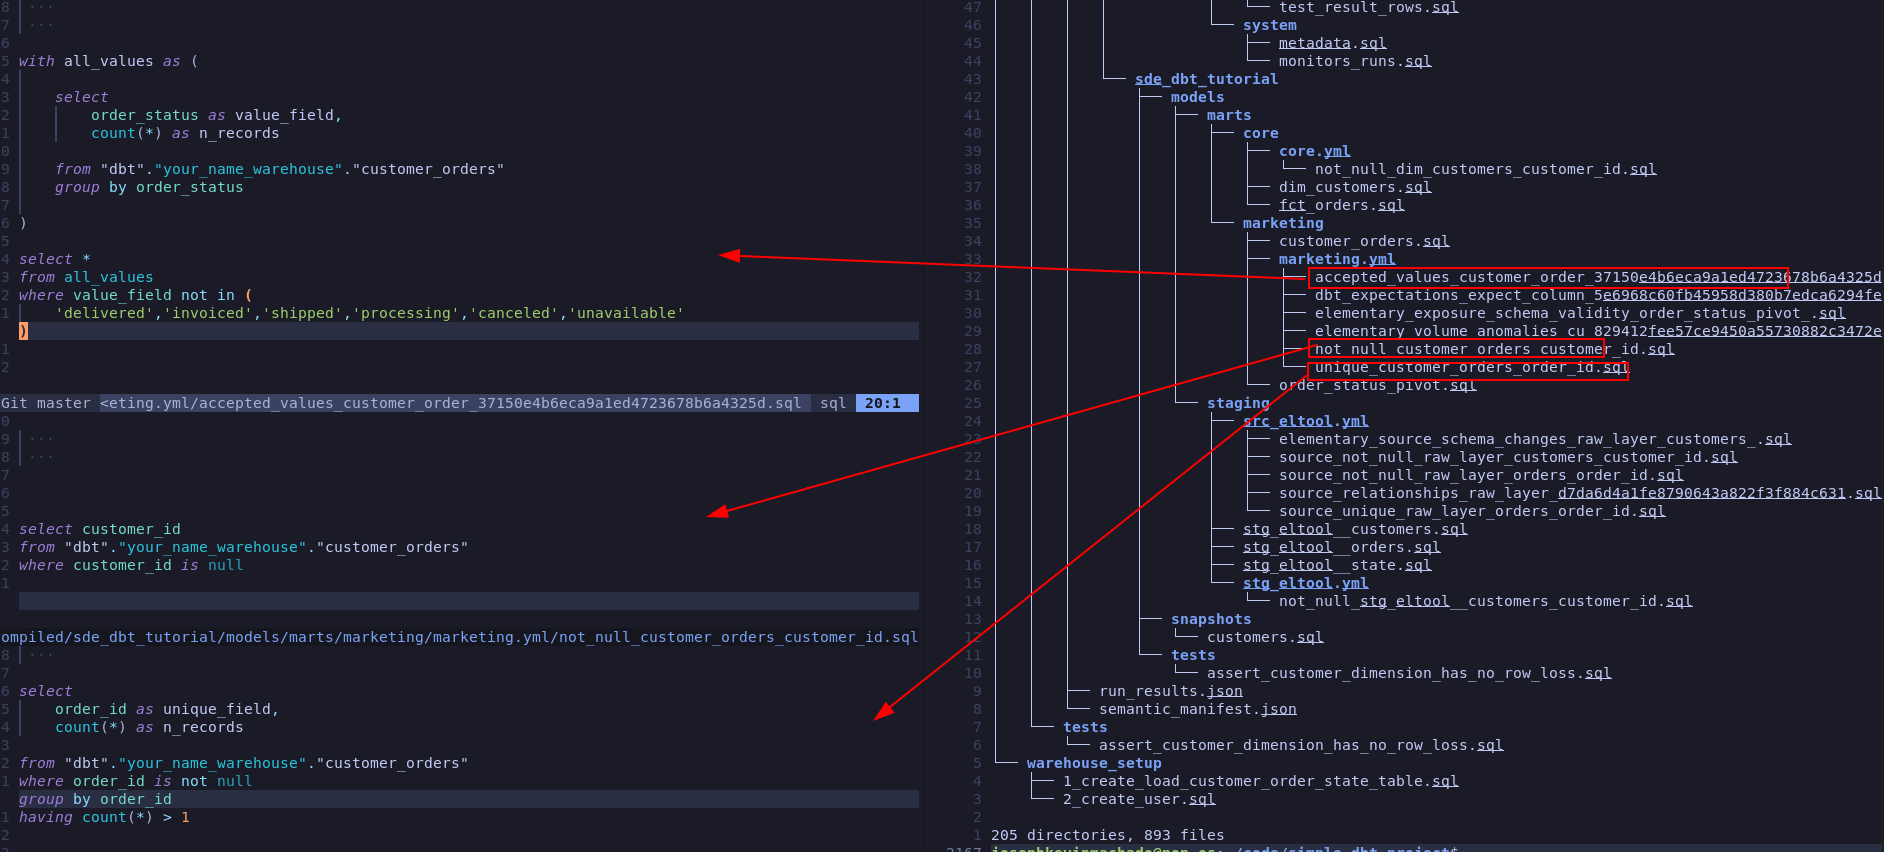
Only run the necessary data quality tests, or write your own implementation which can run the data quality tests with minimal number of scans.
Take a look at this GitHub issue where dbt test’s huge performance issues are discussed.
Another thing to watch out for are freshness tests, these are either run by a tool like dbt or in house scripts, and involve calculating the amount of time that has passed since the last load for data into a table. The freshness test typically involves a query like max(datetime_column) - now(). If your table is large and not clustered properly this can result in a table scan and running the freshness test for tables at different times will also keep the warehouse on for longer periods of time.
3.3.3. Replace semantic layer with pre-aggregated tables to avoid multiple table scans
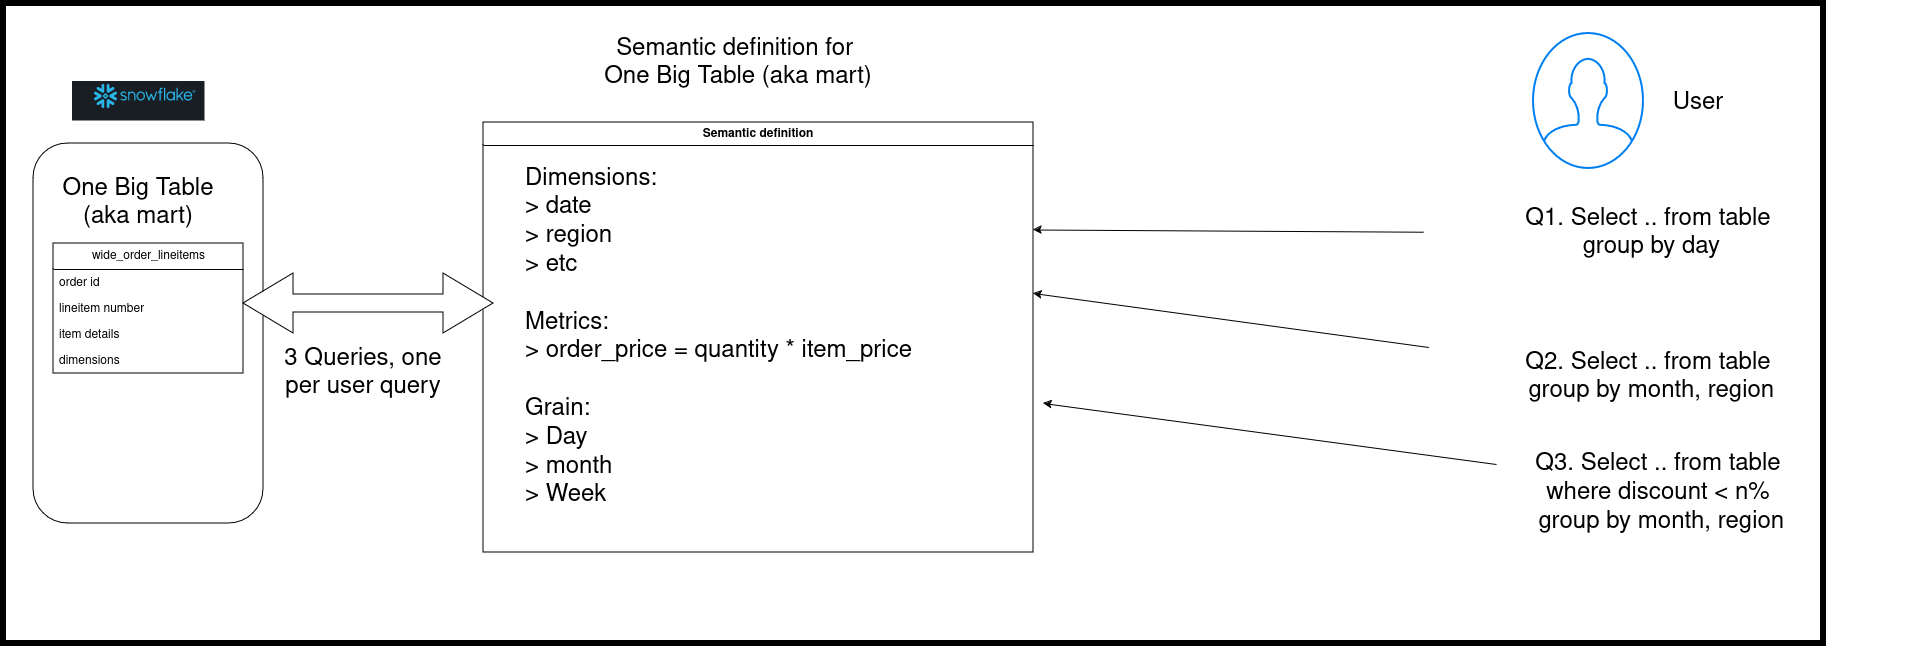
Semantic layer is an interface that allows end users/stakeholders/BI tools to query the data at necessary granularity. The power of semantic layer is that it enables defining metrics at a single source controlled repo and saves data engineers the trouble of having to create a table/view for each required granularity.
Since analytical queries are often run repeatedly with slightly different filters and group by’s this results in the semantic layer having to recompute the data multiple times.
Let’s look at a simple semantic layer implementation on top of a wide table (fact + multiple dimension table). The wide tables, aka One Big Table, aka mart table are a common pattern in data pipelines.
Depending on the query WHERE/GROUP BY clauses the semantic layer will run queries which will scan the large table, this is very expensive! In order to avoid multiple re-computations on this wide table, you can create pre-aggregated tables at the necessary granularities.
For example most end users are fine with data being up to date as of the last hour/day, etc. Analytical users tend to look at data aggregated at a day level or higher and as such pre-aggregation can provide a significant amount of cost savings.
If you have very large granular (fact) tables, you can aggregate them to different levels to save on cost, such as
- dim1, dim2, date
- dim1, dim2, week
- dim1, dim2, month
A few tips on building pre-aggregate tables:
Build aggregate tables incrementally, i.e. don’t use the entire wide table to create aggregate tables. Only aggregate the past n time period(n depends on your use case).- Store the metrics that make up the non additive metrics as individual columns. For example if you have to create average, percentage, etc store sum and count as individual columns.
Use lower granular aggregate tables to build higher granularity tables. For example if you are building aggregates at hour, day and week level, first build table at hour level, use the hour level table to build the day level table and so on. This will ensure that the large OBT table is only scanned when absolutely needed, there by saving on processing costs.

Trade offs: While pre-aggregated tables can save a lot of money, it also introduces work to create and manage the aggregate tables.
3.3.4. Limit data used for development and PR builds
Limit the amount of data you use for local development and ensure that any CI runs that you have also use the lowest amount of data possible.
3.4. Setup monitoring for continued cost reduction
You can look at query history to analyze usage, here are some tips to make monitoring and future analysis easier.
3.4.1. Set up cost alerting with resource monitor
Use Snowflake’s resource monitor to create alerts at account and warehouse level. Shown below is a simple example of setting a monitor per account to ensure that the account admin gets notified on 75% credit usage.
create or replace resource monitor ACCOUNT_MONITOR with
    credit_quota=5 -- Credits that can be used to run the resource monitor
    frequency=daily -- Frequency of resource monitor run
    start_timestamp=immediately -- Indicates when this resource monitor will start, note you can also specify an end data
    triggers
        on 75 percent do notify; -- Indicates what to do when specific usage threshold is met, note that there are option to suspend services as well

ALTER ACCOUNT SET RESOURCE_MONITOR=ACCOUNT_MONITOR; -- Assign the resource monitor to an account, we can also assign it to a warehouse level
Note that resource monitors themselves costs money to run.
3.4.2. Track granular usage with object and query tags
When analyzing usage, its helpful to segment (aka slice and dice) by warehouse, department, pipelines, etc. We can do this with
- Object tags : Which are tags that can be applied to warehouses, roles, and users, etc (see here for list of objects that can be tagged ).
- Query tags : Which are tags that can be applied to a specific account, user, and session.
Let’s see how to set tags for a warehouse:
-- Tags set at object (in this case warehouse) level
CREATE TAG ENGINEERING ALLOWED_VALUES 'data_engineering', 'product_engineering';

ALTER WAREHOUSE COMPUTE_WH SET TAG ENGINEERING = 'data_engineering';

select *
  from table(information_schema.tag_references('compute_wh', 'warehouse'));
Query tags enables us to tag the queries run in a session, this can help us tag the queries that are run as part of a data pipeline (e.g. dbt has an option to set query tag ). Let’s see how we can set a query tag for a session and check the tagged query.
-- Query tag, tags set per sessions

alter session set query_tag='data_engineering_query_lvl';
select * from snowflake_sample_data.tpch_sf1.orders limit 5;

select query_tag, *
from table(information_schema.query_history())
order by start_time desc
limit 5;
Note: Checkout Snowflake’s ACCOUNT_USAGE schema for a wide range of usage metrics, but be aware of the latency.
4. Conclusion
Snowflake like most data vendors, will let you charge yourself to oblivion! It is our responsibility as users to ensure that the costs are kept under control. If you are working on a cost reducing initiative or want to add a point for your resume/promotion, remember to
- Get some quick savings by changing warehouse settings
- Analyze usage and optimize queries and tables
- Consolidate pipeline patterns
- Setup alerts and monitoring on resource usage
Next time you run into SF cost issues, try these steps. If this helped you, I’d love to see a screenshot or some numbers, send them to help@startdataengineering.com.
5. Read more about using Snowflake
6. References
If you found this article helpful, share it with a friend or colleague using one of the socials below!
When signing a contract, you will typically get a set number of credits for a period(say 1-3 years) and the credit will be split over the contract period. With multiple varying credit usage, computing the actual bill can be tricky. Typically the most expensive part would be compute.