What are the types of data quality checks?
- 1. Introduction
- 2. Data Quality(DQ) checks are run as part of your pipeline
- 3. Run a background data monitoring job
- 4. Not all DQ failures require you to stop the pipeline
- 5. Cost of DQ checks
- 6. Data quality tools
- 7. Conclusion
- 8. Further reading
1. Introduction
Data quality(DQ) is a critical component of any data pipeline. Having good DQ checks in place is the difference between being stuck in an all-hands-on-deck meeting where someone notices a 50% revenue drop versus getting peaceful sleep at night.
If you are wondering
What are the data quality checks that I need to add to my pipeline?
How do you add the most effective data quality checks to your pipeline?
Do all data quality checks run as part of a pipeline?
If so, this post is for you. By the end, you will have a clear picture of the different types of DQ checks, when to use them, and how to prioritize which DQ checks to implement.
2. Data Quality(DQ) checks are run as part of your pipeline
There are three significant points in your data pipeline where you can add DQ checks.
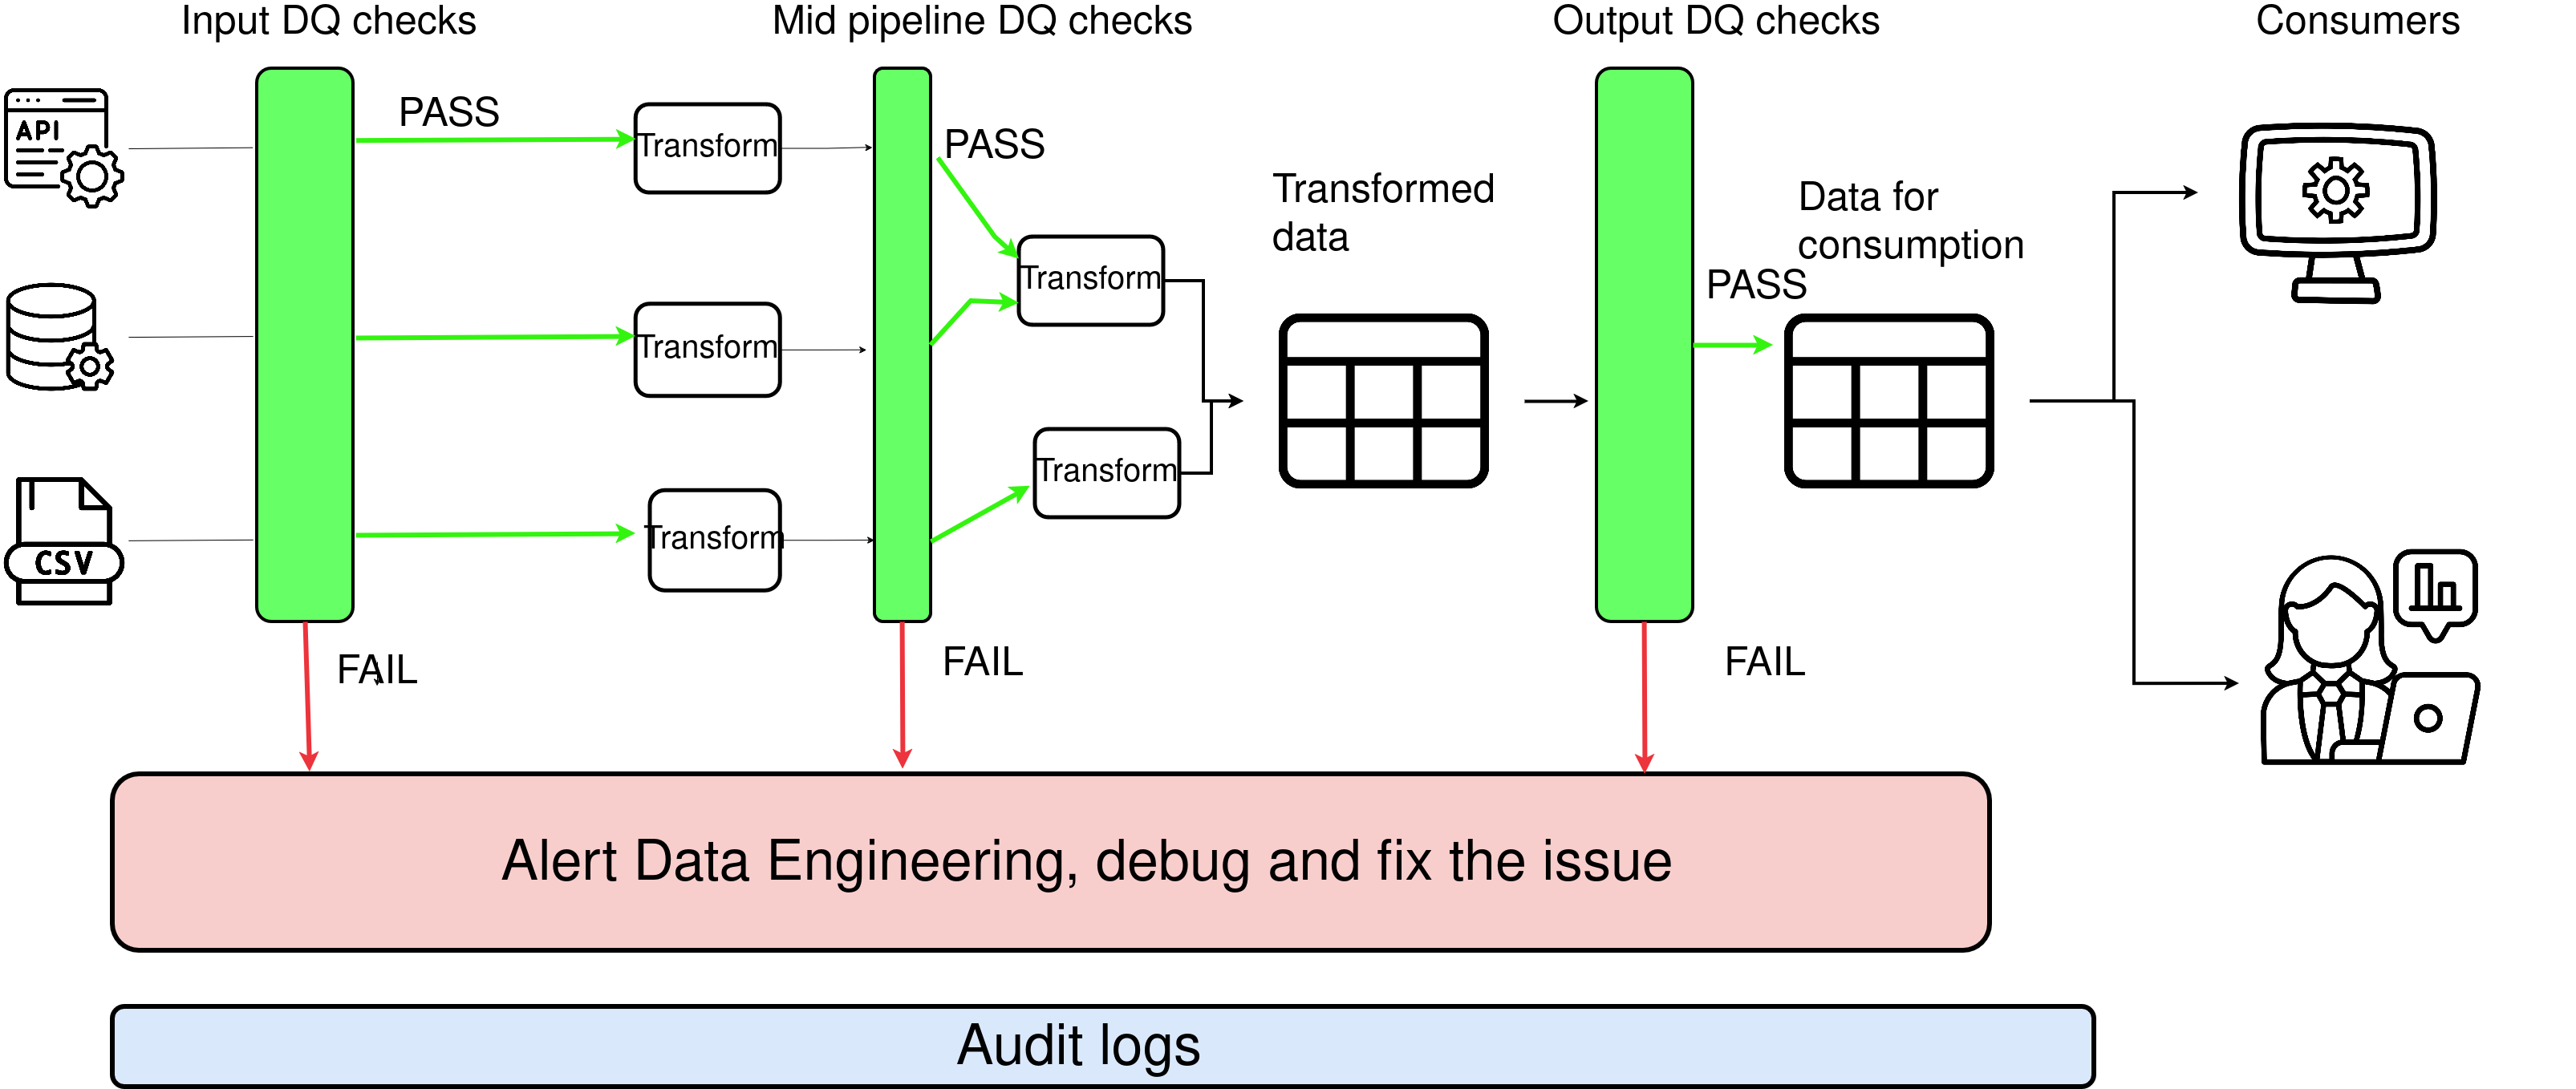
Let’s look at them in their (typical) order of priority:
2.1. Ensure your consumers don’t get incorrect data with output DQ checks
You should ensure that the consumers of the data you produce do not get incorrect data. Consumers with access to incorrect data can cause irreparable damage in terms of business cost, wrong decision-making, monetary cost, or loss of trust with the client.
Here are the types of DQ checks suited for output DQ checks:
Table constraint checksare meant to check your(data engineers) expectations about a table. Constraint checks include checking for null, uniqueness, completeness, if the values are in permissible ranges, etc.Business rules are checksmeant to check the business people’s expectations about the data. Business rules include a date belonging to a range; revenue should always be positive except when it’s a refund; purchase date should be later than the item available date unless it’s a preorder, etc. These are critical assumptions of the data necessary for the end users to be able to use the data with confidence.Table schema checksare meant to ensure that the output column names and types remain the same (as the last pipeline run). These act as an integration check for your downstream consumer. For example, if your revenue goes from USD (decimal) to USD_cents (integer), you must establish this with your consumers before changing the data.Metric variance checksare meant to ensure that the key metrics of your dataset (such as revenue, conversion rate, etc.) remain within permissible ranges compared to historical data. For example, if your pipeline runs daily and your revenue drops by 50%, you should be able to detect this before making the data available to your end user. The columns critical for your business to make money should fall in this category.Row count distribution checksensure that the number of rows across pipeline runs remains similar. For example, if the number of people visiting your website has tripled compared to previous runs, you need to check for why behind the jump.Reconciliation checkscompare row counts of the output data with the corresponding input data. For example, if you are transforming an input orders table into a wide_orders(output) table, you want to ensure that the number of orders in the output is the same (unless there are filters) as the number of orders in the input table.
The metric variance and row count distribution checks (metrics variance and distribution checks) are very sensitive to seasonality. At the same time, you can use a simple percentage change-based check to compare numbers with paste data; using standard deviations with a rolling window to compute outliers may be a more suitable option (see elementary ).
2.2. Catch upstream issues quickly with input DQ checks
If you are working with unreliable data sources, input DQ checks are extremely important to avoid unnecessary data processing costs and reduce the time it takes to fix an issue.
Here are the types of checks for Input DQ
Table constraint checks(similar to the output table constraint checks).Table schema checksare meant to check if the input sources have the expected data types and all the required columns. You can catch it quickly if your upstream teams drop a key column.Referential integrity checkswith other inputs are meant to check if the joins (that you will do as part of data processing) work as expected. If there is some upstream change to a field you use for joining, you can detect it here.Row count distribution checksensure that the number of rows with the current input is consistent with the previous pull.
If your pipeline is inexpensive(both in cost and time to run), you may be able to skip input DQ checks. However, input DQ checks enable quick detection of issues and, thus, resolution.
2.3. Waiting a long time to run output DQ checks? Save time & money with mid-pipeline DQ checks.
If your data pipeline is complex and involves multiple transformation layers, you may benefit from mid-pipeline DQ checks.
Mid-pipeline DQ checks are run after a transformation but before the next step. If there is a failure, you will be able to quickly identify the source and re-run only the necessary transformation steps.
Use the DQ checks similar to the above two layers.
2.4. Track incoming and outgoing row counts with Audit logs
As data flows through your pipeline, keep track of the number of rows of inputs and number of rows in the output for each task (a task can be a transformation or a set of transformations).
Having this audit log of the number of input and output rows of each step will help you identify count-distorting issues (e.g., faulty join causing duplicate rows, incorrect filters, etc.).
Depending on how well your tasks are separated, this will also help analysts with root-cause analysis of business problems.
3. Run a background data monitoring job
In addition to DQ checks that run as part of your pipeline, most companies also have separate jobs that monitor the state of your data.
Depending on your needs, this monitor job can be run every 30 minutes, for one hour, etc.
3.1. Is your data as recent as you need? Aka data freshness
Data freshness refers to how recent the data is. For example, if your consumers require the data to be no later than one hour, your pipeline should run in a period shorter than one hour.
Typically, data freshness is calculated as current time - max(datetime_inserted). The freshness metric will depend on the time the monitoring job is run.
3.2. Metrics to monitor
There are cases where specific fields will need DQ checks, but failure of which may not require us to stop our pipelines.
Typically, the same types of checks as output DQ checks are run as part of the monitoring job.
4. Not all DQ failures require you to stop the pipeline
Most companies have severity levels for DQ check failures. The most common ones are
Low (Informational): These checks are primarily for informational purposes and do not indicate immediate issues. They help monitor the data pipeline’s health and provide insights that can be used for optimization or future reference. For example, record counts with slight variation or new patterns like new categories in a category field.Medium (Warning): These checks indicate potential issues that could affect the data pipeline’s efficiency or output quality. They require attention but are not immediately critical, Such as Missing data or range violations.High (critical): These checks indicate serious issues that need immediate action to prevent significant problems in the data pipeline. They could lead to incorrect data being processed or critical failures in the pipeline. E.g., Data schema violation, business rule failures, etc
Typically, only high-severity DQ issues require us to stop and fix the pipelines. Low—and medium-severity DQ issues are analyzed and fixed in predefined schedules.
5. Cost of DQ checks
While adding as many DQ checks as possible may seem like a good idea, doing so will significantly impact the speed and cost of your pipelines.
Most DQ tools run each test as a single table scan; this means your costs will skyrocket, and your pipelines will be slow.
Make sure to prioritize, adding only the necessary DQ checks.
6. Data quality tools
Many DQ tools are available in the OSS and vendor market. Some of the most popular ones are:
Great expectations: ✅ Lots of DQ checks, Works with multiple backends, Detailed results (failure sample, percentage completeness, etc.), Ability to store results, and ability to work with various types of inputs. ❌ It is incredibly complicated to set up and debug.dbt tests, dbt expectations, & elementary: ✅ Extremely easy to set up, works well with dbt, and is extendable with macros. ❌ It is expensive to run, has no compile time checks, and results are not as detailed as great expectations.Cuallee✅ is easy to set up, fast, and can be easily added to any Python code. It provides detailed results but ❌ does not log results.
7. Conclusion
If you have no DQ checks, a good rule of thumb is to do the following (in order):
- Add output checks & log results
- Add input checks & log results
- Add freshness monitoring & create a dashboard for this
These will take you a long way. Please let me know in the comments section below if you have any questions or comments.
8. Further reading
If you are interested in learning more about data quality, check these articles:
- Implementing DQ checks with great expectations
- Implementing anomaly detection, schema checks, and DQ dashboard on dbt with elementary
- Using great expectations with Apache Spark
If you found this article helpful, share it with a friend or colleague using one of the socials below!
I really appreciate with the contents you are sharing in the form of Blogs, very clear and concise. I really enjoy reading your blogs, it gives me in-depth knowledge on business and technical topics related to DE. Thank you so much sharing such type of content.
Thank you for the very kind words :) Glad that you are getting knowledge from my posts!!!