How to decide on a data project for your portfolio
1. Introduction
Whether you are looking to improve your data skills or building portfolio projects to land a job, you would have faced the issue of deciding what and how to build data projects. If you are
Struggling to decide what tools/frameworks to use for your portfolio data projects
Not sure that what you are building is serving any purpose
Then this post is for you! Imagine being able to quickly make a potential referrer or hiring manager understand that you have the expertise they are looking for. By showing them exactly what they are looking for, you improve your chances of landing an interview.
By the end of this post, you will have an algorithm that can help you decide what tools/frameworks to use for your data project to get the most out of your time.
2. Steps to decide on a data project to build
We will review the steps you can follow to build your own data projects. Follow the steps in the order they are specified.
2.1. Objective
You need to identify your objective for building a data project. Typical objectives are usually a combination of the following:
- Skill growth: You want to learn new skills/tools. For example, if you are primarily in an SQL shop and wish to practice Spark,
- Job search: The key idea is to show a potential employer that you have the skills(& more) necessary for a job.
When building data projects for job search, it would be easier to start with some background research, as shown below.
2.2. Research
Before building a data project, you must critically analyze what you plan to build. While this may not be as exciting as using the tools you like, it is invaluable in showcasing your potential employers’ expertise.
Let’s look at the key areas to focus on:
2.2.1. Job description
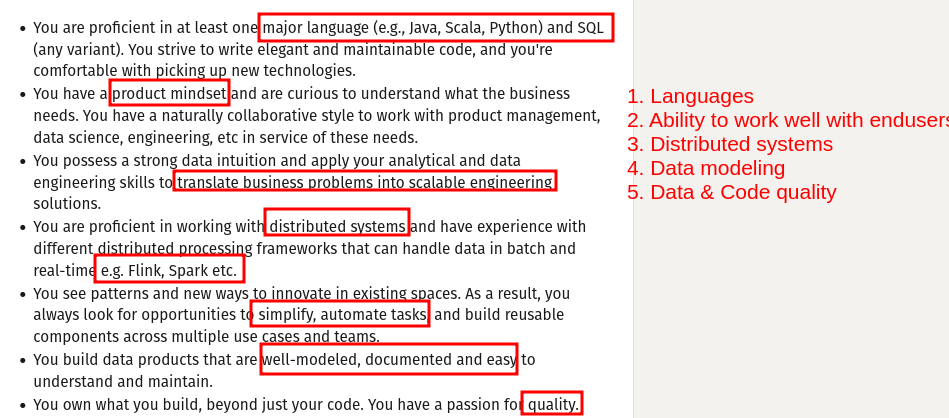
If you want to apply for a job (or a similar job), look at the job description.
Identify the tools (Spark, AWS EMR, Flink, etc.) and the processes they require (data modeling, data quality, stakeholder communication, etc.).
Let’s look at an example:
2.2.2. Potential referral/hiring manager research
If you plan to get a referral (highly recommended over just applying), then it’s crucial to research them on LinkedIn. If you cannot get a referral, get this information from the hiring manager’s LinkedIn profile.
Here’s what you need to look for in their current job:
- What project does this person work on?
- What tools/frameworks/processes do they specify?
- What data(ads, IOT, etc) do they specify?
- Do they work on system processes, e.g., Monitoring, CI/CD, etc?
2.2.3. Company research
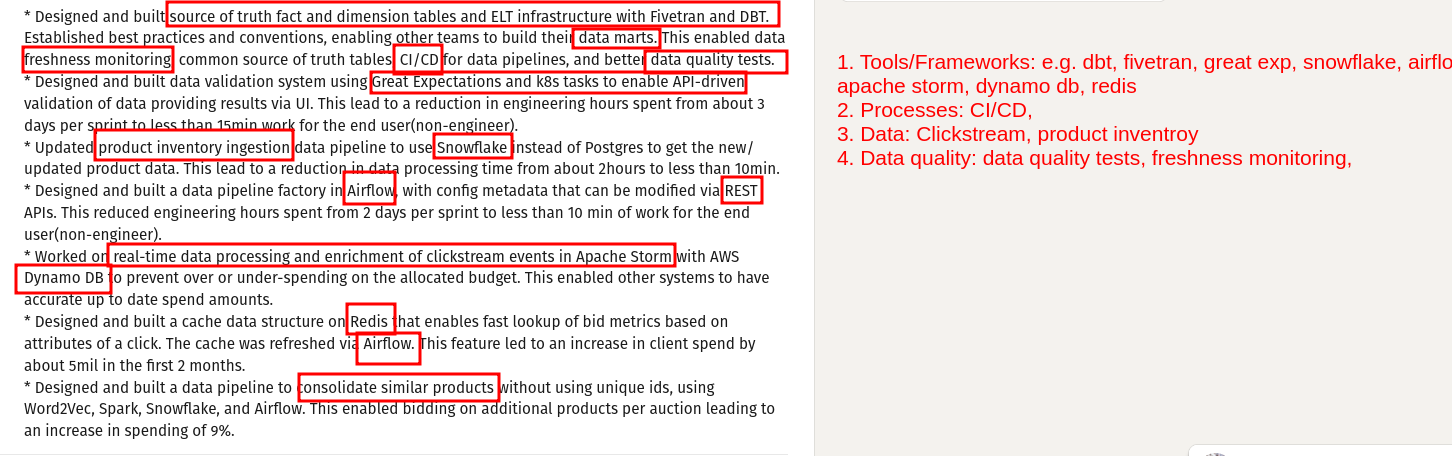
With smaller companies, you can directly see the data/tools/frameworks that they are working on from their websites.
After this research, you should have a clear picture of the following:
Languages usedData tools usedInfrastructure (AWS, GCP, Databricks, etc)Data flow and modeling used (e.g., Medallion, dbt flow, Kimball dimensional modeling, data vault, etc.)Processes used (CI/CD, DQ measurements, etc)Types of data that they work with
These are the tools/frameworks and data that you need to build your data project. Note that some cloud services can be expensive (or have a limited free trial). You can either use an OS alternative or the free trial limit to build your project.
2.3. Data
The next step is finding input data for your project. Here are a few options to help you get the data required:
2.3.1. Dataset Search
You can search for input data in
-
Kaggle : Kaggle hosts datasets for machine learning, competitions, and analytics projects. It’s an active community with contributions from data scientists worldwide.
-
Google Dataset Search : Google’s dataset search engine indexes datasets from across the web. It covers various topics and sources, from research papers to governmental and institutional datasets.
-
Data.gov (USA Government) : The U.S. government’s open data portal. It offers datasets on various topics, including agriculture, climate, education, energy, and health.
-
UCI Machine Learning Repository : UCI’s repository is a go-to for machine learning datasets, with over 500 datasets on different problems like classification, regression, and clustering.
-
AWS Public Datasets : Amazon Web Services hosts various open datasets, particularly useful for cloud-based analytics and AI applications.
-
European Union Open Data Portal offers datasets from the European Union’s institutions and bodies, covering areas such as economics, health, environment, and transportation.
-
World Bank Open Data provides access to global development data, covering indicators related to the economy, education, poverty, health, and more.
-
Awesome Public Datasets (GitHub Repository) : A community-maintained GitHub repository that compiles links to various publicly available datasets.
-
FiveThirtyEight Data : The datasets behind stories from the data journalism site FiveThirtyEight cover topics like politics, sports, economics, and culture.
-
UN Data (United Nations) : The United Nations’ database offers data on global development indicators, health, demographics, and economics.
-
Open Data by City and Government: Many cities and countries have their own open data portals, offering data specific to local governments and municipalities. Examples:
- https://data.london.gov.uk/ (London)
- https://data.cityofnewyork.us/ (New York)
- https://data.gov.sg/ (Singapore)
-
OpenStreetMap : This service provides geographic data, such as maps and geolocation information, for free use.
-
Harvard Dataverse : A data repository run by Harvard University, offering datasets from research across various disciplines.
These platforms offer datasets for various use cases, including machine learning, data science, academic research, and public analysis.
2.3.2. Generate fake data
If you can’t find data relevant to your use case. You can use LLMs to define and create fake data. Let’s look at an example:
Example: fake data generation with Open AI
2.4. Outcome
The outcome from your data pipeline should be impactful. You can typically do this(for portfolio projects) by showing how some metrics behave overtime or showing a correlation between metrics
Example: Ideating insights with Open AI
2.4.1. Visualization
To create a captivating outcome, create a dashboard that you can host (free with GitHub pages). The simplest way to do this is using Quattro (or any static website generator).
2.5. Presentation
When a potential referrer or a Hiring manager looks at your resume, you need to ensure that the key points are visible and highlighted.
Here’s what you need to do
- Create a GitHub repo for your project.
- Start the README.md with the data flow architecture, this image should clearly show how data flows through your system.
- Link to the hosted dashboard with a screenshot.
- Tools/frameworks used with icons.
For an example of how to follow the above steps, see this repo .
The key idea is that anyone checking out your repo should immediately know that you know
- The data that their company deals with
- Data flow architecture
- Tools/frameworks/processes used at their company
3. Conclusion
To recap, we saw
- Researching company and people to determine data and tools to use
- Discovering available data or generating fake data with LLMs
- Presentation that highlights your expertise
Don’t shoot from the hip the next time you are looking to build a data project. Use the steps above to decide on what to build. Please let me know in the comment section below if you have any questions or comments.
4. Read these
- How to build a data project
- What are the parts of data engineering
- Build a data project to impress hiring managers
If you found this article helpful, share it with a friend or colleague using one of the socials below!